

Passenger traffic continued to rise and revenue reached €816.6 million, but higher fuel and emissions costs, currency effects and disruption in the Middle East pushed profitability sharply lower. An aviationlife.gr analysis of the numbers shows an airline whose demand remains resilient but whose cost equation has become considerably more demanding.
ATHENS – AEGEAN carried more passengers and generated more revenue during the first half of 2026. Yet almost every major measure of profitability moved in the opposite direction.
The airline reported €816.6 million in revenue, up 3.8% from €787 million a year earlier, while passenger traffic increased 3% to 7.77 million passengers. EBITDA, however, declined 7% to €145.3 million, EBIT dropped 35% to €38.5 million and the bottom line moved from a €47.9 million profit to a €3.3 million loss.
That divergence is the central story behind AEGEAN’s first-half results.
The numbers do not point primarily to a demand problem. They point to something more complicated: AEGEAN is growing, but the cost of producing that growth has risen faster than the revenue it generates.
Revenue Rises as Profitability Retreats
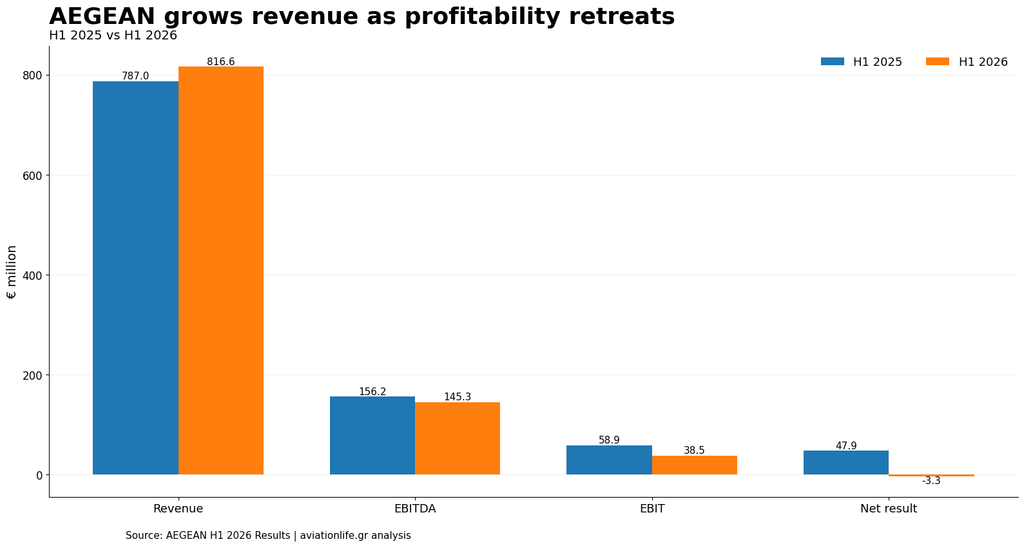
AEGEAN grows revenue as profitability retreats. H1 2025 vs H1 2026, € million. Source: AEGEAN | aviationlife.gr analysis.
The gap between revenue and earnings becomes clearer when viewed through unit economics.
AEGEAN’s RASK, or revenue per available seat kilometre, increased 2% to 8.09 euro cents. But EBIT-level CASK, the corresponding measure of unit cost, increased 5% to 7.85 cents.
Yield increased 3%, from 9.84 to 10.09 euro cents, but that improvement was not enough to absorb the broader increase in costs.
The result was margin compression across the income statement. EBITDA margin declined from 19.9% to 17.8%. EBIT margin fell from 7.5% to 4.7%, while the pre-tax margin moved from 8.4% to -0.7%.
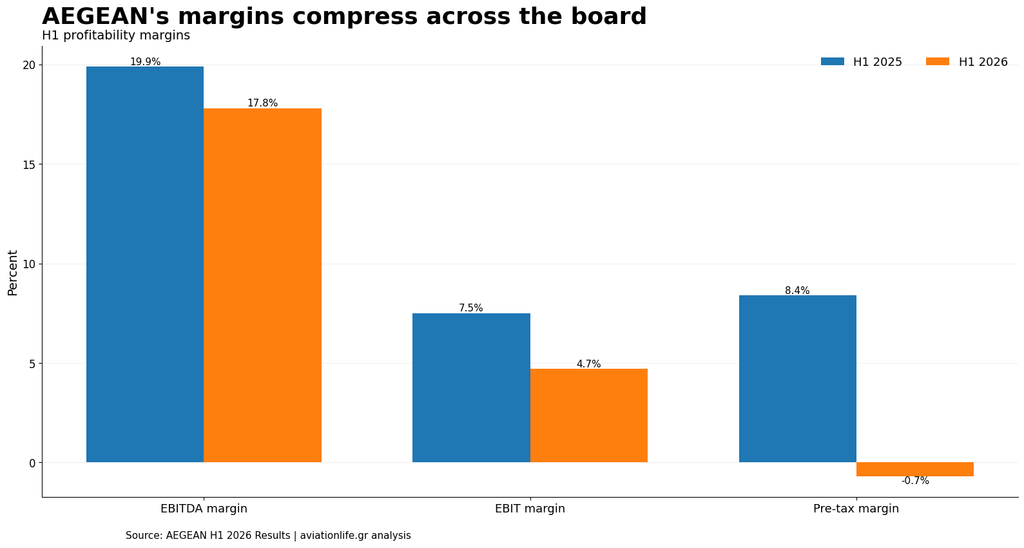
AEGEAN’s margins compress across the board. H1 2025 vs H1 2026. Source: AEGEAN | aviationlife.gr analysis.
There is, however, an important detail beneath those headline numbers.
Excluding fuel and emissions allowances, EBIT-level CASK was essentially unchanged: 5.60 cents in H1 2025 versus 5.59 cents in H1 2026.
That is significant. It suggests that the deterioration in profitability was not simply the result of a broad loss of cost discipline across the airline’s operations. Instead, a substantial part of the pressure can be traced to specific external cost factors.
The Cost Shock: Fuel, Maintenance and Carbon
Fuel remained one of the biggest challenges.
AEGEAN’s aircraft fuel expense increased 11%, from €165.7 million to €184.3 million. Maintenance expenditure increased 15% to €112.1 million, while employee costs rose 7% to €105.1 million.
The most dramatic percentage increase came from emissions allowances, where expenditure doubled from €21.9 million to €43.8 million.
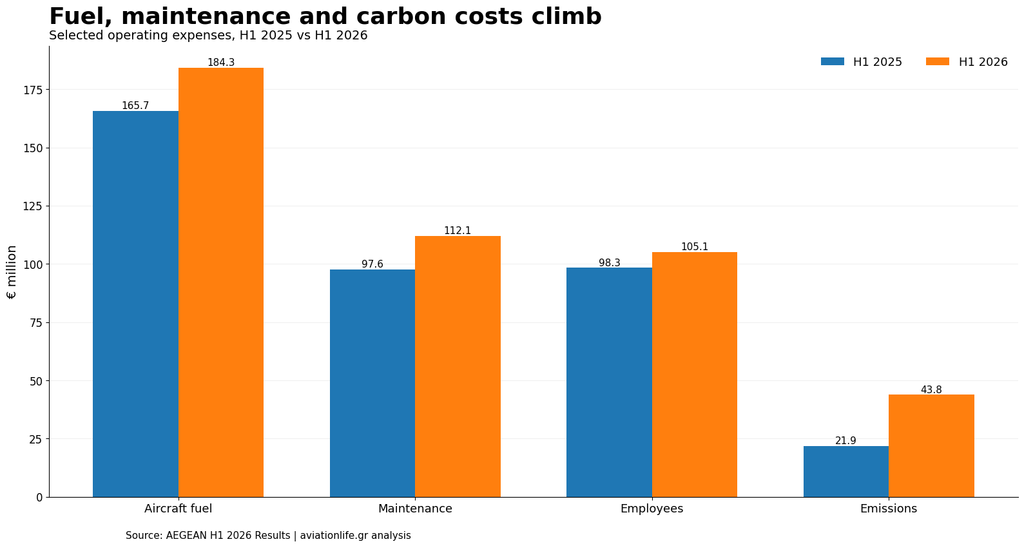
Fuel, maintenance and carbon costs climb. Selected H1 operating expenses, € million. Source: AEGEAN | aviationlife.gr analysis.
According to AEGEAN, the net combined burden from higher fuel prices and emissions allowances reached €40 million, even after the significant benefit provided by hedging contracts.
€40 million
Net H1 burden from higher fuel prices and emissions allowances, after hedging.
To put that into perspective, €40 million is equivalent to roughly 28% of AEGEAN’s reported H1 EBITDA of €145.3 million.
And the issue has not disappeared with the end of the first half. Management said jet-fuel prices remained approximately twice their level at the beginning of the year, leading the company to plan a particularly disciplined capacity policy for at least the next six to eight months.
A €44.7 Million Currency Swing
Fuel and emissions do not tell the entire story.
Foreign-exchange valuations produced a €14.1 million loss during the first half of 2026. During the corresponding period of 2025, AEGEAN had recorded a €30.6 million gain.
The year-on-year difference is therefore approximately €44.7 million.
This helps explain why the deterioration becomes considerably more pronounced further down the income statement. EBIT remained positive at €38.5 million, yet the Group ultimately recorded a €5.7 million pre-tax loss.
The distinction matters when assessing underlying operating performance: the net result was affected not only by airline operations but also by a substantial reversal in foreign-exchange effects.
Domestic Greece Provides the Growth
AEGEAN carried 7.768 million passengers during the first half, compared with 7.572 million a year earlier.
But the geographical composition of that growth tells a more interesting story.
Domestic passenger traffic increased 6%, from 3.092 million to 3.276 million passengers.
International traffic, by comparison, was virtually unchanged, rising only marginally from 4.480 million to 4.492 million.
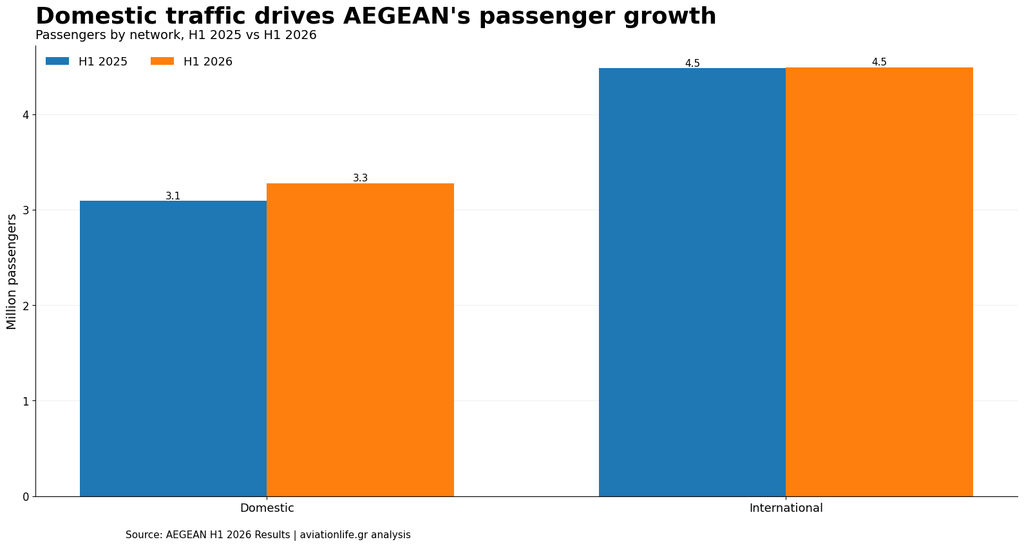
Domestic traffic drives AEGEAN’s passenger growth. Passengers by network, H1 2025 vs H1 2026. Source: AEGEAN | aviationlife.gr analysis.
The imbalance partly reflects the geopolitical environment.
AEGEAN said developments in the Middle East affected parts of its international network for four months, from March through June. The disruption affected not only the airline’s ability to operate certain services, but also demand for connecting passenger traffic to and from the region through Athens.
That second-order effect is strategically important.
As Athens increasingly functions as a connecting hub within AEGEAN’s network, disruption to destinations beyond Greece can affect passenger flows across multiple sectors rather than only the suspended route itself.
More Capacity, but Slightly Lower Utilisation
The airline offered 9.685 million seats, up 3%, while available seat kilometres increased 2% to 10.091 billion.
RPKs, however, increased only 1% to 8.090 billion.
Consequently, the RPK/ASK load factor declined 0.8 percentage points, from 81.1% to 80.3%. The passenger-based load factor similarly fell from 81.0% to 80.4%.
The decline is modest and does not indicate a collapse in demand. But in a high-cost environment, incremental changes in aircraft utilisation become more consequential.
The network also became somewhat shorter-haul. Average flight distance declined 3%, from 915 kilometres to 891 kilometres, while the average number of seats per flight increased slightly from 156 to 158.
AEGEAN H1 2026 at a Glance
| Key Metric | H1 2025 | H1 2026 | Change |
|---|---|---|---|
| Revenue | €787.0m | €816.6m | +3.8% |
| Passengers | 7.572m | 7.768m | +3% |
| Available seats | 9.374m | 9.685m | +3% |
| ASKs | 9.883bn | 10.091bn | +2% |
| RPKs | 7.999bn | 8.090bn | +1% |
| Load factor (RPK/ASK) | 81.1% | 80.3% | -0.8pp |
| EBITDA | €156.2m | €145.3m | -7% |
| EBIT | €58.9m | €38.5m | -35% |
| Net result | €47.9m | -€3.3m | – |
| EBITDA margin | 19.9% | 17.8% | -2.1pp |
Source: AEGEAN H1 2026 Results | aviationlife.gr analysis.
The Balance Sheet Remains the Counterweight
The income statement shows pressure. The balance sheet tells a considerably more defensive story.
AEGEAN held €956.1 million in cash, equivalents and other financial investments at June 30, an increase of €114 million compared with June 2025.
That position was maintained despite the payment of €81.1 million in dividends, equivalent to €0.90 per share, in May.
Borrowings also declined. Loan liabilities fell from €664.2 million at the end of 2025 to €518.3 million at June 30, although lease liabilities increased from €971.1 million to €1.114 billion.
Net debt stood at €676.4 million and net debt/EBITDA remained at 1.6x. Excluding leases, however, AEGEAN was in a €437.8 million net cash position, compared with €290.9 million at the end of 2025.
Operating cash generation was also strong. Net operating cash inflows reached €299.4 million, compared with €228.9 million in the first half of 2025, an increase of roughly 31%.
That creates a crucial distinction between profitability pressure and financial stress.
The former is clearly visible in the first-half numbers. The latter is not.
Fleet Investment Continues
AEGEAN is also continuing its fleet-renewal programme despite the more difficult operating environment.
Five new Airbus A321neo aircraft joined the fleet during the first half, taking total deliveries from the Airbus neo family to 43 aircraft: 21 A320neo and 22 A321neo.
Two additional A321neos are expected by the end of September.
The significance of fleet renewal becomes greater when viewed against the cost pressures evident in the results. New-generation aircraft are not merely instruments for network expansion; they form part of the airline’s longer-term response to fuel efficiency and operating-cost pressures.
The First Signal From the Summer Is Positive
AEGEAN’s first-half numbers end in June, but management provided one significant indication of subsequent trading.
During July and August, passenger traffic increased 4.8%, with growth described as balanced between the domestic and international networks.
That suggests demand remained resilient through the peak summer period.
The more important question, however, is no longer simply how many additional passengers AEGEAN can carry.
It is how profitably it can carry them.
What the Numbers Really Say
Revenue +3.8% | Passengers +3% | EBITDA -7% | Net Result -€3.3m
Taken in isolation, the final figure might suggest a significant deterioration in the airline’s underlying position. Taken together with the rest of the data, the picture is more nuanced.
Demand continued to grow. Unit revenue improved. Domestic traffic remained particularly strong. Ex-fuel and emissions EBIT-level unit costs were effectively flat. Liquidity remained close to €1 billion, operating cash generation strengthened and fleet investment continued.
At the same time, fuel and carbon costs rose sharply, international growth stalled amid geopolitical disruption, load factor edged lower and a €44.7 million year-on-year swing in foreign-exchange valuations amplified the deterioration at the bottom of the income statement.
For the remainder of 2026, the metrics worth watching are therefore not passenger numbers alone.
They are fuel prices, capacity discipline, RASK versus CASK, international traffic recovery, load factor and the normalization of Middle East operations and connecting flows through Athens.
AEGEAN has shown that it can continue to grow through an unusually difficult first half.
The next test is harder: turning that growth back into expanding margins.


